Genes & Cancer
Impairement of HT29 cancer cells cohesion by the soluble form of neurotensin receptor-3
Fabienne Massa1,*, Christelle Devader1,*, Sandra Lacas-Gervais2, Sophie Béraud-Dufour1, Thierry Coppola1 and Jean Mazella1
1 Institut de Pharmacologie Moléculaire et Cellulaire, Université de Nice-Sophia Antipolis, Valbonne, France.
2 Centre Commun de Microscopie Appliquée, Université de Nice-Sophia Antipolis, Nice, France
* These authors contributed equally to the work
Correspondence to: Jean Mazella, email: [email protected]
Keywords: soluble sortilin, cell morphology, desmosomes, cancer, neurotensin
Received: June 3, 2014
Accepted: July 25, 2014
Published: July 27, 2014
This is an open-access article distributed under the terms of the Creative Commons Attribution License, which permits unrestricted use, distribution, and reproduction in any medium, provided the original author and source are credited.
ABSTRACT:
The neurotensin (NT) receptor-3 (NTSR3), also called sortilin is a multifunctional protein localized at the intracellular and plasma membrane level. The extracellular domain of NTSR3 (sNTSR3) is released by shedding from several cell lines including colonic cancer cells. This soluble protein acts as an active ligand through its ability to bind, to be internalized in the human adenocarcinoma epithelial HT29 cells and to stimulate the PI3 kinase pathway. The aim of this study was to investigate cellular responses induced by sNTSR3 in HT29 cells. The cellular functions of sNTSR3 were monitored by immunofluocytochemistry, electron microscopy and quantitative PCR in order to characterize the cell shape and the expression of adhesion proteins. We evidenced that sNTSR3 significantly regulates the cellular morphology as well as the cell-cell and the cell-matrix adherens properties by decreasing the expession of several integrins and by modifying the structure of desmosomes. Altogether, these properties lead to an increase of cell detachment upon sNTSR3 treatment on HT29, HCT116 and SW620 cancer cells. Our results indicate that sNTSR3 may induce the first phase of a process which weaken HT29 epithelial properties including desmosome architecture, cell spreading, and initiation of cell separation, all events which could be responsible for cancer metastasis.
INTRODUCTION
Numerous extracellular molecules are involved in the activation of gastrointestinal cancer tissues growth. Among these effectors, several neuropeptides are known to act as growth factors through their receptors which are often overexpressed in tumors [1]. These neuropeptidergic systems are targeted for diagnosis and therapy by tools designed to modulate receptors activities [2]. From these tumors, some cells can be disseminated by complex mechanisms leading to the appearance of metastasis [3].
Molecules that are responsible for the development of both cancer growth and metastasis are either abnormaly secreted from intracellular secretion vesicles like neuropeptides or released by shedding from the plasma membrane like Epidermal Growth Factor Receptor (EGFR) ligands. Indeed, EGFR ligands are transmembrane proteins that can be cleaved by matrix metalloproteases (MMPs) and released in the extracellular medium to act on their receptors [4]. Another family of proteins has been recently shown to be shedded by similar mechanisms. This family, named Vps10p protein family [5], is constituted by type I receptor proteins and includes sortilin, SorLa, and SorCs 1-4 [6]. The extracellular part of these proteins can be released from the plasma membrane by MMPs [7, 8]. However, the putative function of these soluble proteins, as well as the action of their counterpart intracellular domains, remain to be determined. The roles of the proteins from the Vps10p family are already known to be multiple and complex, and concern their functions as receptors or co-receptors and their involvement in the sorting of proteins to lysosomes or to the plasma membrane (for review, see [9]).
Recently, the soluble form of sortilin [10], also called neurotensin (NT) receptor-3 (NTSR3) [11], has been described as a functional molecule for its ability to bind and to be internalized in the human adenocarcinoma cell line HT29 [12]. In this work, it has been also demonstrated that sNTSR3 activated both Akt and Erk1/2 signaling pathways by a mechanism dependent on the focal adhesion kinase.
In the present study, we sought to examine the role of sNTSR3 on the morphology and behaviour of the colonic epithelial cancer cells HT29. Our data show that sNTSR3 incubation on HT29 cells leads to several changes in cell shape including actin reorganization and cell morphology in relation to a decrease of several integrins. sNTSR3 also induces a strong modification in the architecture of desmosomes. We demonstrate that sNTSR3 induces detachment of several colonic cancer cells including HT29, HCT116 and SW620 cell lines. Taken together, our results demonstrate that the soluble form of NTSR3 may regulate, by a complex mechanism, the fate of the human colonic adenocarcinoma cell line HT29, especially during the initial step of cell detachment.
RESULTS
Morphological changes of HT29 cells induced by sNTSR3.
We previously demonstrated that sNTR3 activates the PI3 kinase pathway and increases the intracellular concentration of calcium [12]. Since these pathways play significant roles in cell morphology [14, 15], we attempted to evaluate the role of sNTSR3 in the fate of HT29 cells.
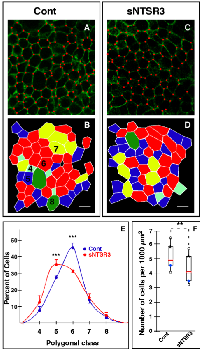
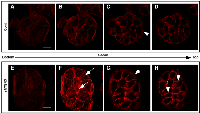
Using confocal imaging, we observed that the geometric cell shape of HT29 cells, analyzed after E-cadherin labeling, was modified after sNTSR3 treatment. The geometric distribution (polygon classes) of epithelial mammalian cells has recently been described to reflect their modifications of states [16]. In resting cells, the geometric distribution showed that 46% of HT29 cells were hexagons (Fig. 1A, B, E) consistent with published data on keratinocytes [16] and in drosophila epithelial cells [17]. Interestingly, in sNTSR3 treated cells, we observed a significant reduction in the proportion of hexagons (p<0,01), Fig. 1E) with a concomitant increase in the proportion of pentagons detected after 60 min and maintained up to 15 h (p<0,01, Fig. 1C, D, E). Moreover, in cells incubated in the presence of sNTSR3 the alteration of cell topology was associated with an increase in cell surface. The size of HT29 cells was assessed by counting the number of cells per 1000 µm2 which varied from 5.1 ± 0.2 cells in the absence of sNTSR3 to 4.2 ± 0.17 cells in the presence of 10 nM sNTSR3 for 30 min (Fig. 1F) (n = 25, p<0.01). This significant decrease in the number of cells per mm2 suggests an increase of the cell surface.These observations led us to study the cytoskeleton modification induced by sNTSR3 treatment. Therefore, we examined the shape of actin cytoskeleton upon stimulation with sNTSR3. From a series of a z-scan performed by confocal microscopy from the bottom to the top of cell clusters, we observed several important changes on the cell morphology. First of all, we visualized an increase of actin stress fibers (Fig. 2F, arrows) and a disruption of actin labeling throughout the membrane of peripherical cells (arrowheads) upon stimulation with 10 nM sNTSR3 (Fig. 2G) compared to non-treated cells (Fig. 2C). Interestingly, we also observed an increase of actin concentration in cell junctions (Fig. 2H, fine arrows).
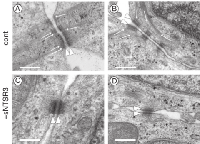
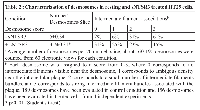
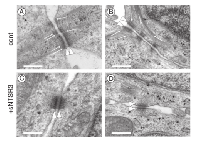
In agreement with a reorganization of actin microfilaments and a change of cell shape, we wanted to determine whether some ultrastructural components were altered. Using electron microscopy, we observed in sNTSR3 treated cells a modification in the architecture of numerous desmosomes and intermediate filaments (Fig. 3). Desmosomes fortify cell-cell adhesion by connecting proteins forming these structures to the intermediate filament cytoskeleton and therefore participate to tissue integrity and homeostasis [18]. From a series of electron microscopic images taken under control or sNTSR3 stimulated HT29 cells conditions, we counted the average number of desmosomes per 70 nm cell slice. A decrease from 5.06±0.34 desmosomes/cell slice (189 desmosomes counted) in control to 3.63±0.31 (p<0.01) desmosomes/cell slice (156 desmosomes counted) in treated cells was quantified (Table 2). More important was the observation that, although intercellular densities associated with cadherins appeared to be similar in both conditions, sNTSR3 treatment caused distinct changes in desmosomal architecture (Fig. 3). The plaque densities are generally associated with intermediate filament bundles in the resting cells (Fig. 3A and B), this was not the case for sNTSR3 treated cells where intermediate filament bundles were rarely visible in the close vicinity of desmosomes (Fig. 3C and D). In numerous resting cells, the intermediate filament bundles were strongly observable. Some intermediate filaments were arranged at right angles to the plane of desmosomes (Fig. 3A), others were more tangential (Fig. 3B). By contrast many sNTSR3 treated cells showed plaque densities without or with weak intermediate filaments (Fig. 3C and D). Therefore, we scored (from 0 to 3) all desmosomes obtained in the two conditions [19]. The results (Table 2) indicated an important loss of intermediate filament connections (score 2 and 3) from 92% in resting cells to 38% in sNTSR3 treated cells.
Modification of the expression of proteins involved in cell-cell and cell-matrix junctions by sNTSR3.
The impressive changes observed in the HT29 cell shape, led us to investigate whether the expression of proteins involved in cell-cell junctions or cell adhesion were altered (Fig. 4). As suspected the mRNA expression of E-cadherin was almost totally inhibited after a 6 hours treatment with sNTSR3. This result confirms the observation of a modification of the cell-cell junction. Moreover the expression of several integrins, including alpha1, alpha7, alphaV, beta4, beta6 and beta8 was also inhibited following treatment of HT29 cells with sNTSR3 (Fig. 4). The integrins serve as adhesion receptor for extracellular matrix proteins, the decrease of their expression highlights a weakening of cell-matrix adhesion.
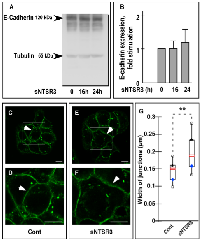
The protein content analysis of E-cadherin did not confirm the qPCR results (Fig. 5A and B). This is likely due to the high stability of E-cadherin during the time course of the experiment. The stability of the protein was confirmed by the absence of co-localization of E-cadherin labeling with lysosomes of sNTSR3 treated or not treated cells (not shown). However, the E-cadherin localization was disrupted by sNTSR3 treatment visualized by a more diffuse labeling of the protein of treated cells (Fig. 5E and F). The labeling obtained allowed us to observe an increase in the width of the E-cadherin labeling at the cell-cell junctions upon a 60 min treatment with sNTSR3 (arrows in Fig. 5E and F). Therefore, we measured the width of E-cadherin labeling and observed a significant increase from 0.15 to 0.19 µm (Fig. 5G) (n = 25, p<0.01), suggesting a disruption of cell-cell contacts.
These results indicate that the action of sNTSR3 means to fragilize the interactions between eptithelial cells, both at the cell-cell and the cell-matrix level.
sNTSR3 promotes cancer cells detachment
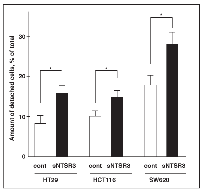
The weakening of cell-cell junctions and cell-matrix junctions could be the first step leading to cell detachment. To verify the potential role of sNTSR3 to trigger cell dissemination, we performed detachment experiments on both HT29, SW620 and HCT116 cell lines (three different human cancer cells). When cells were incubated under low serum concentration (0.1% FCS), the amount of detached cells after 24h was 8.3 ± 2.1% for HT29 cells, 10.1 ± 1.3% for HCT116 cells and 18.3± 2.4% for SW620 cells (Fig. 6). In the presence of 10-8 M sNTSR3, this amount raised to 15.8 ± 2% for HT29 cells (p<0.05), to 14.9 ± 1.8% for HCT116 cells (p<0.05) and to 27.3 ± 3% for SW620 cells (p<0.05) (Fig. 6). These data suggest a role of sNTSR3 in cell detachment of colonic cancer cell lines.
DISCUSSION
NTSR3, also called sortilin, displays several known functions from a role as a receptor [20] to trigger the NT-induced human microglial migration, or a co-receptor as shown for its interaction with NTSR1 in HT29 cells to mediate NT signaling or with the p75 neurotrophin receptor (p75NTR) for proNGF-induced neuronal cell death [20, 21, 22]. NTSR3/sortilin also exerts intracellular functions to sort for examples the two-pore potassium channel TREK-1 to the plasma membrane [23], the sphingolipid activator proteins to lysosomes [24] and the brain-derived neurotrophic factor to the regulated secretion [25].
Interestingly, previous studies have already observed a correlation between NTSR3/sortilin expression and malignancy as characterized in glioma where the increase in the expression of NTSR3/sortilin was positively correlated with the malignancy of the tumor [26]. The level of NTSR3/sortilin expression was also increased in several colorectal cell lines that are models for primary and metastatic tumor cells [27]. These observations underline the putative function of NTSR3/sortilin in the process of tumoregenicity.
However, although the release by shedding of its extracellular domain upon activation of protein kinase C has been already described in primary cultured neurons and several cell lines including colonic cancer cells [8], nothing was known about the function of this released soluble protein. We recently showed that sNTSR3 is an active protein by its ability to bind, to internalize and to trigger intracellular signaling in HT29 cells. In the present work, we provide evidence that sNTSR3 strongly affects the HT29 cell morphology and adhesion properties.
First, we observed a modification of the geometric cell shape of cells treated with sNTSR3. The proportion of hexagons decreased in favour of pentagons. In agreement with these observations, a recent work describes a polygonal distribution favouring hexagons during cell-cell contact formation of human keratinocytes epithelial cells [16], a topology similar to those of Drosophila, Xenopus or Hydra [17, 28]. A modification in the distribution of geometric cell shape indicates that the amount of junctions between cells are affected as shown by the depletion of Rock1/Rock2 kinases in human keratinocytes [16]. However, by contrast to human keratinocytes, the change of the geometric topology of HT29 cells is correlated with a change of cell surface of HT29 cells, a discrepancy certainly due to the difference of cell types.
The second important consequence of sNTSR3 treatment is a weakening of the cell-matrix contact. We observed a rapid and complete reorganization of the cytoskeleton of epithelial HT29 cells upon sNTSR3 stimulation. The actin microfilaments, surrounding the inner side of peripheral cells plasma membranes and responsible for the shape of the cell, are totally disorganized. Moreover, treated cells present an important increase in stress fibers, a response of the cell to modify the cell-matrix contact which can lead to migration. This observation is correlated with the activation of the focal adhesion kinase by sNTSR3 [12], and added to the weakening of extracellular junctions should lead to cell migration [29]. Since HT29 cells are non-migrating cells, these results suggest a first step of a new mechanism that could lead to cell detachment.
We demonstrated, by using a qPCR approach, that several alpha and beta integrins expressed in HT29 cells are down regulated after 6h exposition to sNTSR3. In particular, the expression of integrins alpha1, alpha7, alphaV, beta4, beta6 and beta8 is significantly decreased upon incubation with sNTSR3. Interestingly, the couple alphaV/beta8 has been shown to mediate epithelial homeostasis by regulating the activities of gene families involved in cell-matrix interactions [30]. The decrease of alphaV/beta8 expression induced by sNTSR3 could be responsible for the topological changes observed on HT29 cells. Loss of integrins couples has been detected in adenocarcinoma of the lung [31, 32], in human colonic epithelial cells [33, 34], and has been correlated with a poor prognosis. The decrease of several members of the integrin family induces a weakness of cell-matrix adhesion. As a result the cells tend to get loose from the plate. In order to compensate this phenomenon, we observed the apparition of actin stress fiber and focal adhesion point, which maintain the cell attached to the matrix.
Moereover, we demonstrated that the sNTSR3 treatment strongly affected cell-cell contact. As measured by qPCR analysis, the expression of E-cadherin, a transmembrane protein involved in cell-cell adhesion, decreased in sNTSR3 treated cells. Consequently we speculated that a loss of the protein will greatly reduce the strength of the interaction between cells. Even if we did not detect a decrease of the E-cadherin protein level, its cellular distribution was severely affected. At the cell junction, the localization of the protein appeared more diffuse. E-cadherin being part of the tight junction, it is present between the cells in the extracellular medium, and it maintains the neighbouring cells close to each other. We could speculate that the diffused E-cadherin localization at the cell-junction could be due to the separation of neighbouring cells, stretching the E-cadherin proteins and so increasing the width of the E-cadherin labelling. So the strength of the interaction between cells could be more fragile.
This hypothesis is strengthened by the observation of a disorganization of the desmosomes plaques, components of the tight junction. Electron microscopic experiments demonstrated that at the ultrastructural level both the number and the architecture of desmosomes were affected in sNTSR3 treated cells. The amount of strong intermediate filament bundles associated with the plaque densities which form desmosomes were dramatically reduced, as previously reported in keratinocytes depleted of a member of the plakin family, desmoplakin [19]. This disruption of desmosomes architecture is in agreement with the overall observations from this work where the action of sNTSR3 on HT29 cells is the embrittlement of cell-cell and cell-matrix interaction. The importance of desmosomes integrity has been demonstrated in several diseases and particularly in cancer progression. Indeed, the loss of desmosomes structure or components has been observed in the development or the progression of several human epithelial cancers (for reviews see [35, 36]). Finally, we demonstrated that the weakening of cell-matrix and cell-cell contact lead to cell detachment: sNTSR3 treatment significantly increased both HT29 and HCT116 cell detachment (Fig. 6), an important property which could be responsible for further cell dissemination and metastasis.
In conclusion, our results indicate that sNTSR3 greatly modifies the HT29 cell shape, weaken the cell-cell interaction and reduces the cell-matrix interaction. sNTR3 may initiate the epithelial to mesenchymal transition, including desmosome structure disruption, cell-cell and cell-matrix weakening and then initiation of cell separation. sNTSR3, likely by acting through a specific membrane receptor which remains to be identified, is able to trigger an intracellular signaling (ie: Erk1/2 and/or Akt [12]) which leads to cellular modifications including a strong modification of cell adhesion and cell-cell contacts. Another possibility is that sNTSR3 can bind to specific growth factors and then can inhibit their effects. However, we recently demonstrated that sNTSR3 specifically binds to HT29 homogenates [12], which is rather in agreement with the first hypothesis. We clearly defined a role of sNTSR3 on tissue cohesion alteration with desmosome structure disruption and the initiation of cell separation. The importance of this finding on cell dissemination remains to be investigated.
METHODS
Materials
Dulbecco’s modified Eagle’s medium (DMEM) was from Life Technologies Inc. and fetal calf serum from Lonza. Gentamicin, mowiol, paraformaldehyde, mammalian protease and phosphatase inhibitor cocktails were from Sigma France. The soluble recombinant human NTSR3/sortilin protein (Ser78-Asn755; MW = 76 kDa from R&D systems) was resuspended in PBS containing 0.1% bovine serum albumin (BSA) as a carrier following the manufacturer’s recommendations. All control conditions were made using PBS containing 0.1% BSA. Monoclonal antibodies against E-cadherin and NTSR3/sortilin were from BD Bioscience. Alexa-594-phalloidin was from Invitrogen. Alexa-488 conjugated donkey anti-rabbit and Alexa-594 conjugated donkey anti-mouse antibodies were obtained from Jackson Immunoresearch Laboratories. HRP conjugated goat anti-rabbit and anti-mouse were from Cell Signalling.
Cell culture
The human cell lines HT29, HCT116 and SW620 were maintained in DMEM supplemented with 10% FBS and 50 µg/ml gentamicin at 37°C under 5% CO2.
Immunocytochemistry
Cells were plated on glass coverslips coated with 1 mg/ml poly-L-lysine. Two days later, cells were preincubated for 10 min in phosphate-buffered saline(PBS) and then either incubated or not (control) with sNTSR3 (10-8 M) for indicated times. Then, cells were fixed 20 min with 4% paraformaldehyde in PBS at room temperature. Coverslips were rinsed twice with PBS and incubated with 50 mM NH4 Cl in PBS for 10 min to quench excess of free aldehyde groups. After 20 min in PBS containing 3% Horse Serum (HS) and 0.1% Triton-X100, cells were labelled with either the anti-E-cadherin (1/400) or with the Alexa-595-phalloidin (1/500) for 2 h at room temperature in PBS containing 0.5% HS and 0.1% Triton-X100. Cells were rinsed three times in PBS and incubated for 45 min at room temperature with a Alexa488-conjugated donkey anti-mouse antibody (1/400) in PBS containing 0.5% Horse Serum and 0.1% Triton-X100. After two washes with PBS and one with water, coverslips were mounted on glass slides with mowiol for confocal microscopy examination.
Confocal microscopy observations were performed with a Laser Scanning Confocal Microscope (TCS SP5, Leica, Rueil Malmaison, France) equipped with a DMI6000 inverted microscope, using a Plan Apo 63x/1,4 NA oil immersion objective. The fluorescent markers were respectively and sequentially excited by the 488 nm and 561 nm wavelengths of an argon and Diode Pumped Solid-State laser. Fluorescence was detected through 500-540 nm (Alexa-488) and 590-650 nm (Alexa-594) spectral windows. Images were acquired as single transcellular optical section and averaged over 12 scans/frame.For cell shape analysis (cell area and polygon class), images were analyzed using ImageJ software. For cell area analysis, intact cells in monolayer were numbered using nucleus labeling with a home-made macro. All the images of Dapi-labeled nuclei stored in a folder were treated automatically. First, the images were filtered to improve nucleus detection and second, the counting was done using the « Find Maxima » function configured to detect one local maxima per nucleus. The number of nuclei was normalized by the image surface. A total of 520 for control cells and 372 for sNTSR3-treated cells was determined. The polygon class of each cell was assigned by counting the number of vertices of the cell, only intact cells in monolayers were quantified (cells at the image border were excluded), a total of 252 for control cells and 265 for sNTSR3-treated cells from 3 independent experiments. The width of cell-cell junction in a monolayer was drawn and measured directly for each cell contact using ImageJ. A total of 55 cell contacts for control and 52 cell contacts for sNTSR3-treated cells were analyzed.
Electron microscopy
For transmission electron microscopy analysis, the cells were fixed in 1.6% glutaraldehyde in 0.1 M phosphate buffer, rinsed in 0.1 M cacodylate buffer, post-fixed for 1h in 1% osmium tetroxide and 1% potassium ferrocyanide in 0.1 M cacodylate buffer to enhance the staining of membranes. Cells were then rinsed in distilled water, dehydrated in alcohols and lastly embedded in epoxy resin. Contrasted ultrathin sections (70 nm) were analyzed under a JEOL 1400 transmission electron microscope mounted with a Morada Olympus CCD camera.
Western blot analysis.
Proteins from HT29 cells incubated for various times with sNTSR3 (10-8 M) were denaturated by boiling at 95°C for 3 min using 2x Laemmli sample buffer, resolved using 10% acrylamide gels and subsequently electroblotted onto nitrocellulose membranes. Membranes were blocked with 5% skim milk in PBS and incubated in the same buffer with the mouse anti-E-cadherin antibody (1:1000) overnight at 4°C. The bound antibody was visualised using an HRP-conjugated goat anti-mouse antibodies by chemiluminescence reagents, with a Fujifilm Intelligente Darkbox LAS-3000 detection apparatus.
Primers design and real-time qPCR
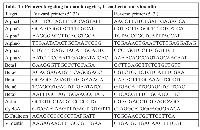
Primers were designed as previously described [13]. Primers, synthesized by Eurogentec, were targeted against human sequences of integrin alpha1, alpha2, alpha3, alpha6, alpha7, alphaV, beta1, beta4, beta5, beta6, beta7, beta8, and cyclophilin A and beta-actin as reference genes (Table 1). Every set of primers has been designed using intron spanning assay as required by the Universal Probe Library Software from Roche Diagnosis. Non specific products formation has been verified for each set of primers with the melting curve realized by the LightCyclerTM 480 Software.
Real-time pPCR was performed on the LightCyclerTM 480 (Roche) using the LightCyclerTM 480 SYBR Green 1 Master mix (Roche). The PCR reaction was performed in 20 µl volume containing 16 ng cDNA, 10 µl 2x LightCyclerTM 480 SYBR Green 1 Master mix and 1 µl of primer mix (10 µM forward primer, 10 µM reverse primer). The PCR profile was as follows: 5 min at 95°C, followed by 45 cycles of 10 sec at 95°C, 10 sec at 60°C and 10 sec at 72°C. The Ct value of each gene of interest was normalized to the Ct of the reference genes as follows : ∆CTnorm = Ctgoi-Ctref with Ctref = (CtbACT x CtCycloA)(1/2) with
norm
= normalized, goi = gene of interest, and ref = reference gene. ∆∆CT = ∆CT experimental condition - ∆CT control condition. Values were expressed as 2-∆∆Ct normalized using the 10% FCS condition as control.
Cell detachment experiments
SW620, HCT116 and HT29 cells, plated in 48 well-dishes (4 x 10⁵ cells/dish), were incubated at low serum concentration (0.1%) for 24h in the absence (control condition) or in the presence of 10 nM sNTSR3. Cells recovered in the medium (detached cells) were quantified using a CASEY Model TT Cell Counter (Roche Applied Sciences, Indianapolis). Remaining plated cells were recovered by trypsin treatment and quantified as above.
Statistics
Each median value is obtained from 6 to 12 determinations, box plots show medians, 25% and 75% percentiles, and 5% and 95% percentiles. Significance was determined using the Kruskal Wallis test: *p < 0.05 **p < 0.01 and ***p < 0.005, ns non-significant. For experiments with a low number of assays (n = 3 to 5 for cell shape, qPCR), the Mann and Whitney test was used : *p<0.01, ***p<0.005.
ACKNOWLEDGEMENTS
This work was supported by the Centre National de la Recherche Scientifique (CNRS). We thank Fréderic Brau for his help in confocal microscopy analysis.
- 1. Endocr Rev 24: 389-427.
- 2. Curr Protein Pept Sci 9: 468-477.
- 3. Nat Rev Cancer 2: 442-454.
- 4. Cell Prolif 42: 799-812.
- 5. Cell 77: 579-586.
- 6. Cell Mol Life Sci 66: 2677-2689.
- 7. Biochem J 395: 285-293.
- 8. Biochem Biophys Res Commun 298: 760764.
- 9. Nat Rev Neurosci 9: 899-909.
- 10. (1997) Molecular identification of a novel candidate sorting receptor purified from human brain by receptor-associated protein affinity chromatography. J Biol Chem 272: 3599-3605.
- 11. (1998) The 100-kDa neurotensin receptor is gp95/sortilin, a non-G-protein-coupled receptor. J Biol Chem 273: 26273-26276.
- 12. (2013) Focal adhesion kinase dependent activation of the PI3 kinase pathway by the functional soluble form of neurotensin receptor-3 in HT29 cells. Int J Biochem Cell Biol 45: 952-959.
- 13. (2010) Integrin expression profiling identifies integrin alpha5 and beta1 as prognostic factors in early stage non-small cell lung cancer. Mol Cancer 9: 152.
- 14. Blood 87: 3775-3782.
- 15. (2008) Tetraspanins affect myeloma cell fate via Akt signaling and FoxO activation. Cell Signal 20: 2309-2316.
- 16. (2012) ROCK1 and ROCK2 regulate epithelial polarisation and geometric cell shape. Biol Cell 104: 435451.
- 17. Curr Biol 17: 2095-2104.
- 19. (2008) Plakoglobin is required for effective intermediate filament anchorage to desmosomes. J Invest Dermatol 128: 2665-2675.
- 20. J Neurosci 23: 1198-1205.
- 21. (2004) Sortilin is essential for proNGF-induced neuronal cell death. Nature 427: 843-848.
- 22. Gastroenterology 123: 1135-1143.
- 23. (2010) Spadin, a sortilin-derived peptide, targeting rodent TREK-1 channels: a new concept in the antidepressant drug design. PLoS Biol 8: e1000355.
- 24. EMBO J 22: 64306437.
- 25. (2005) Sortilin controls intracellular sorting of brain-derived neurotrophic factor to the regulated secretory pathway. J Neurosci 25: 6156-6166.
- 26. (2013) ProBDNF and its receptors are upregulated in glioma and inhibit the growth of glioma cells in vitro. Neuro Oncol 15: 990-1007.
- 27. PLoS One 6: e25097.
- 28. Nature 442: 1038-1041.
- 29. Microvasc Res 83: 82-88.
- 30. (2002) The integrin alpha(v)beta8 mediates epithelial homeostasis through MT1-MMP-dependent activation of TGF-beta1. J Cell Biol 157: 493-507.
- 31. (1998) Reduced integrin alpha3 expression as a factor of poor prognosis of patients with adenocarcinoma of the lung. J Clin Oncol 16: 1060-1067.
- 32. (2000) Altered expression and function of beta1 integrins in a highly metastatic human lung adenocarcinoma cell line. Int J Oncol 17: 1187-1194.
- 34. Gut 33: 342-346.
- 35. Nat Rev Cancer 11: 317-323.
- 36. J Pathol 226: 158171.
Last Modified: 2016-06-16 06:10:33 EDT
PII: 22
