Genes & Cancer
Drug sensitivity profiling and molecular characteristics of cells from pleural effusions of patients with lung adenocarcinoma
Rita Ötvös1,2,*,Adam Szulkin1,*, Carl-Olof Hillerdal1, Aytekin Celep1, Eviane Yousef-Fadhel1, Henriette Skribek2, Anders Hjerpe1, László Székely2 and Katalin Dobra1
1 Karolinska Institutet, Department of Laboratory Medicine, Division of Pathology, Karolinska University Hospital, Stockholm, Sweden.
2 Karolinska Institutet, Department of Microbiology Tumor and Cell Biology (MTC), KI Solna Campus, Karolinska Institutet, Stockholm, Sweden.
* RÖ and AS contributed equally to this work.
Correspondence to: Rita Ötvös, email: [email protected]
Keywords: Malignant pleural effusions, ex vivo chemo-sensitivity assay, RRM1, ERCC1
Received: February 11, 2015
Accepted: March 31, 2015
Published: April 1, 2015
This is an open-access article distributed under the terms of the Creative Commons Attribution License, which permits unrestricted use, distribution, and reproduction in any medium, provided the original author and source are credited.
ABSTRACT
We propose to assess the therapeutic value of biomarker-guided individualized chemotherapy in patients with metastasizing lung adenocarcinoma. In this study, we used primary cells from pleural effusions from sixteen patients diagnosed with adenocarcinomas originating in the lung and from four patients with no malignant diagnosis. The ex vivo drug sensitivity of primary cells was assessed for 32 chemotherapeutical drugs. Linear regression analyses were performed to examine possible correlations between the drug sensitivity, overall survival and expression of ERCC1 and RRM1. The ex vivo drug sensitivity profiles of the patients revealed considerable heterogeneity in drug response. Vinblastine, vinorelbine, paclitaxel and actinomycin D showed high efficiency against 50% of the tested primary cells. Significant correlation was detected between the ex vivo sensitivity to platinum based drugs and gemcitabine and the level of ERCC1 and RRM1. No significant correlation was however seen between overall survival and drug sensitivity. The heterogeneity of the drug response suggests that optimal care of the adenocarcinoma patients should include the determination of drug sensitivity of the primary cells and would benefit to use personalized therapy.
INTRODUCTION
Lung cancer is worldwide one of the leading causes of the cancer-related mortality for both men and women.[1] Non-small cell lung cancer (NSCLC) accounts for about 70 to 80% of all lung cancer cases. One subtype of NSCLC is the adenocarcinoma, which corresponds to about 40% of lung cancers.[2] Most cases of adenocarcinoma are associated with smoking; however it is also common in non-smokers and has become even more frequent in women than in men.[3] Primary lung adenocarcinoma are characterized by presence of thyroid transcription factor-1 (TTF-1).[4]
Accumulation of malignant pleural effusion (MPE) is common during NSCLC progression, particularly in adenocarcinomas.[5] The MPE has consistently been shown to indicate a poor prognosis, with a median survival time of 8 to 16 months after diagnosis.[6][7][8] It has been demonstrated that MPEs can be an excellent source for studying ex vivo and in vivo tumor progression and it reproduces the naturally occurring heterogeneity of these tumors.[9][10][11]
The principal chemotherapeutic agents used for treatment of lung adenocarcinoma are platinum analogues in combination with pemetrexed, taxanes or gemcitabine, but the response rates are only 30 to 40%.[12][13] This highlights the need of personalized cancer treatment for these patients. Nowadays an individualized therapy based on molecular biomarkers has been increasingly suggested. For example ribonucleotide reductase M1 (RRM1) and excision repair cross-complementation group 1 (ERCC1) status have been reported to correlate with the therapeutic efficiency of platinum drugs and gemcitabine.[14][15][16] The RRM1 gene encodes the regulatory subunit of ribonucleotide reductase, an essential enzyme that catalyses the reduction of ribonucleoside diphosphates to deoxyribonucleotides which is required for the DNA synthesis. Increased level of RRM1 enables cells to more efficiently repair DNA damage, resulting in resistance to gemcitabine based therapy.[17][18] The function of the ERCC1 protein is predominantly the nucleotide excision repair of damaged DNA, a process that removes DNA adducts caused by platinum drugs.[19] ERCC1-negative tumors have a better response to adjuvant platinum-based chemotherapy, whereas high expression of ERCC1 results in drug resistance.[20]
In the present study we have investigated the drug sensitivity profile of exfoliated tumor cells from patients with metastatic lung adenocarcinoma in order to find successful chemotherapy agents that are not used in current treatment protocols. We attempt to correlate the expression levels of RRM1 and ERCC1 to sensitivity patterns and survival time of patients. We also calculated the drug efficiency by adjusting for drug effect on benign cells and proportion of tumor cells.
RESULTS
Drug sensitivity patterns of primary cells
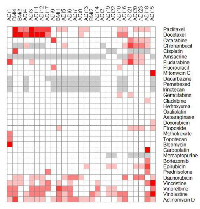
We have evaluated the drug sensitivity patterns of primary cells derived from pleural effusions of sixteen patients diagnosed with lung adenocarcinoma and from pleural effusions of four patients with no malignant diagnosis, using an ex vivo sensitivity assay. In order to avoid changes in the composition of the cell cultures, all samples were tested within 3 days. Each sample was tested against 32 different drugs and in each well the percentage of surviving cells was calculated after 72 hours of treatment. The averaged drug effect is shown in Figure 1. Most of the primary cells were sensitive to actinomycin D, vinblastine, vinorelbine and paclitaxel with a drug effect of 37 to 48. At the same time most primary cells were resistant to oxaliplatin, cladribine, hydroxyurea, bortezomib, prednisolone, methotrexate, asparaginase, carboplatin, dacarbazine, mercaptopurine, irinotecan and cisplatin, where killing effect was <10. Six of cell cultures were treated with a slightly lower concentration of actinomycin D (fifth of the highest concentration), but except for one case, at the highest concentration did not affect 50% of the cells, the drug effect ranging from 19 to 28 (data not shown).
Heat map of cluster analyses
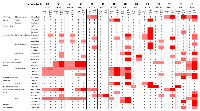
In order to identify possible co-segregation of the sensitivity patterns of the individual drugs and to systematically compare all primary cells with each other, we used Euclidean distance metrics for two-dimensional hierarchical clustering of the drug sensitivity data. The sensitivity of the drug was represented on a five step scale where every step represents less than 50% viability at the four different drug dilutions. Cell isolates with more than 50% live cells were defined as resistant and were presented in white, while experiments with less than 50% of the cells alive at any tested concentration were considered sensitive and were presented in red. Increasing red colors represent sensitivity at lower drug concentrations. Grey means not tested. The graphical presentation of the clustering is shown in Figure 2.Large differences in the chemo-sensitivity of the different primary cell isolates were observed. The proportion of malignant cells in the cell isolates tested for chemo-sensitivity ranged between 10 and 70%. The survival time of the patient from whom the samples were received ranged between 0 and 37 months after diagnoses. Cell isolates from patients with longer survival time seem to be less sensitive to the different drugs and have a slightly higher proportion of malignant cells (Figure 2).
ADi2 was the most resistant cell isolate, not affected by any of the tested drugs. ADi7 was affected by two of the drugs, while several of the isolates were affected by three of the drugs (ADi9, ADi14, ADi22, ADi13 and ADi19). The most sensitive cell isolate, ADi18 was affected by eleven drugs. Multiple isolates were affected by eight different drugs (ADi23, ADi3, ADi1, ADi15 and ADi20). The benign cell isolates were affected by between two and eight drugs (BMi1, BMi2, BMi3 and BMi4).
Actinomycin D, vinblastine, vinorelbine, paclitaxel and daunorubicin were the most effective drugs and affected between 13 and 17 of the malignant cell samples, but similar effect was also seen on the benign cell isolates. Docetaxel, chlorambucil, fludarabine, and epirubicin affected between 6 and 10 of the malignant cell samples while the benign isolates were less affected by these drugs. Several of the tested drugs did not affect any of the primary isolates and this was the case for drugs conventionally used to treat lung adenocarcinoma patients.
Longer survival in patients with samples sensitive to less drugs
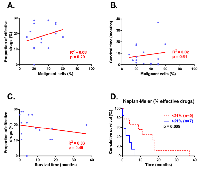
In the survival analysis we included the original sample (ADi6, ADi11 and ADi15) and the papillary groups resembling the clinical manifestation of tumor (ADi20 and ADi23). The proportion of malignant cells was not correlated to the proportion of effective drugs or the survival time of patients in the linear regression analyses (Figure 3A and B). Similarly, survival time and proportion of effective drugs was not correlated (Figure 3C). But Kaplan-Meier analysis showed a significantly longer survival time for patients with cell isolates affected by less than 21% of the drugs compared to patients with samples affected by more than 21% of the drugs (p=0.009, figure 3D).
Adjusting drug effect increased the amount of affected cell isolates
The drug effect on 14 cell isolates was studied and adjusted for average effect on benign cells and proportion of malignant cells in each sample (Figure 4). This adjustment increased the drug effect in almost all samples, independent of the proportion of malignant cells. Several of the cell isolates however remained resistant to a majority of tested drugs. The adjustment also highlighted the potency of some drugs, not only did the effect of pemetrexed increased, but also the effect of fluorouracil, cytarabine, fludarabine, vinblastine, vinorelbine and actinomycin D. These drugs showed efficiency in 36 to 43% of the cells in the primary cell cultures.
Immunocytochemical assessment of ERCC1 and RRM1
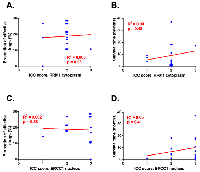
The RRM1 staining was localized and evaluated to the cytoplasm and the ERCC1 staining was localized to the cell nucleus (Additional file 3.). The staining intensities for both proteins were graded on a scale from 0 to 3 corresponding to none (0), low (1), moderate (2) and strong (3) staining intensity. There was no significant difference between high or low expression of either RRM1 or ERCC1 and any of the clinical variables analyzed, which included age and gender (Figure 2). The expression level of RRM1 and ERCC1 showed no statistically significant correlation to survival time or to the proportion of effective drugs (Figure 5).
All four recurrent samples show decreased sensitivity against the tested drugs. Statistically significant correlation was observed between the cytotoxicity of carboplatin/cisplatin and gemcitabine and the levels of RRM1 and ERCC1 expression (Figure 2).
Subgroup analysis
We performed several comparisons dividing the 16 samples in two equal groups, according to high or low proportion of malignant cells, long or short survival time and high or low proportion of effective drugs. For all these analyses, no significant differences was found using a two-tailed unpaired t-test, comparing the different parameters in the two groups (data not shown). When only looking at the seven cell isolates with the highest proportion of malignant cells (above 39% malignant cells) or only on the ten cell isolates with the strongest nuclear ERCC1 staining, no significant correlations were found by linear regression analysis between the different measured factors (data not shown).
All adenocarcinoma showed strong staining for TTF-1, except for two: ADi10 and ADi13 were negative for TTF-1. These MPEs were received from patients who were previously diagnosed with lung cancer. In these cell isolates, the proportion of malignant cells were higher than average (40 and 50%), the RRM1 and ERCC1 staining was similar but the survival time was shorter, only one month. ADi10 was affected by six drugs and ADi13 by three drugs.
Evaluation of cell isolates originating from the same patient
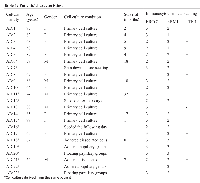
The importance of how primary cells were isolated and the properties of the different fractions were studied. Five of the pleural effusions were separated in different ways (Table 1.) in order to investigate different fractions of the MPEs.
Two cell isolates were seeded two or four days after receiving the samples. This increased the proportion of malignant cells somewhat and the isolates showed distinctly altered pattern of drug sensitivity.
Two of the MPEs were seeded and then divided into three different cell cultures, adherent disassociated cells, adherent papillary groups and floating papillary groups. A comparison of the three different subgroups indicates that the adherent papillary groups are less sensitive to the tested drugs, compared to the adherent dissociated and floating papillary groups. The floating papillary groups showed a lower nuclear RRM1 staining.
DISCUSSION
Lung cancer is one of the tumor types with the highest incidence and mortality worldwide. Chemotherapy is the most common therapy for patients with advanced lung cancer, only a minority of patients having resectable tumors.[13] Currently, therapy with a platinum drug combined with a second drug is the standard first-line treatment, with response rates of 30 to 40%.[13] Better understanding of the biological characteristics of the tumor and predicting response to chemotherapy is needed to improve the clinical outcome of patients with advanced adenocarcinomas.[17] The admixture of benign cells may obscure the results, and is one reason for previous poor correlation between in vitro sensitivity and patient response. The obtained variability in drug response is, however, striking, also when correcting for the content of benign cells. The present study shows that malignant pleural effusions obtained from lung cancer patients can be used to study chemo-sensitivity of adenocarcinoma.
Despite that the primary cells are received from different patients, they show a remarkably similar sensitivity pattern for a number of drugs (paclitaxel, vinblastine, vinorelbine, actinomycin D), but overall a considerable heterogeneity was seen regarding the drug sensitivity. Only one sample was highly resistant to most of the drugs whereas six samples showed good overall sensitivity, with effects from 25% or more of the drugs. Clustering of the drug sensitivity data revealed that the profiles are independent of the age, gender, survival time and expression of RRM1, ERCC1 and TTF-1. Surprisingly, cell isolates from patients with longer survival time seem to be less sensitive to the different drugs and have a slightly higher proportion of malignant cells. One hypothesis might be that tumors with slower proliferation react less to drugs with effects on just proliferation. Inversely, those isolates with less response would grow more slowly, hence with longer survival.
Pemetrexed has been approved as first- and second-line treatment in patients with NSCLC and belongs to antimetabolites, exerting a cell-cycle specific effect. We and others have shown that it has an antiproliferativ effect by inducing cell cycle arrest and S phase accumulation. [11] Therefore the drug affects dividing cells, by inhibiting several key enzymes in the folate-dependent metabolism and causing a decreased nucleotide synthesis. Effect of pemetrexed was observed when adjusting the efficiency for the proportion of malignant cells and average effect on benign cells.
Several examples of individualized therapy based on molecular and immunocytochemical analysis of biomarkers in pleural effusion have been published.[17][21][22][23] In this study we integrated immunocytochemistry with the ex vivo chemo-sensitivity assay. Our results show a significant correlation between level of ERCC1 and RRM1 with the effect of platinum agents and gemcitabine. No significant correlation was seen between overall survival and drug sensitivity in patients with adenocarcinoma. Low levels of RRM1 did not predict better outcomes and ERCC1 expression did not have a prognostic value in this patient cohort. Our findings are in harmony with previous results reported by Valsecchi et al. but opposite to results from Akita et al. that found better outcome for patients with high expression of RRM1 and ERCC1.[24][25] Immunocytochemistry (ICC) provides information on the amount of protein in the cell and its localization; however the commonly used ERCC1 antibody, mAb8F1[26][27], is known to give un-specific cytoplasmic staining and unspecific binding to unknown protein with a similar size. Thus, further studies are needed to establish the role of ERCC1 in metastasizing lung adenocarcinomas.
We were able to subculture two primary cell isolates adherently and in suspension.[9] Surprisingly drugs with similar mechanism of action varied in their effects on samples in different conditions from the same patient. Floating papillary groups had a higher proportion of malignant cells and were more sensitive than the adhered papillary groups. This deserves further analysis and experiments to get a thorough understanding. Meanwhile, it is important to mention that our study has its limitations in the number of patients.
In summary, the analyses of drug sensitivity profiles of the adenocarcinoma patients revealed considerable heterogeneity in drug effect. Vinblastine, vinorelbine, paclitaxel and actinomycin D showed higher efficiency against at least 50% of the tested primary cells. These drugs are not included in the current chemotherapy protocols for treatment of adenocarcinoma but are interesting to further evaluate. However, the heterogeneity of the drug effect also suggest that optimal care of the adenocarcinoma patients would include determination of drug sensitivity and would benefit from the use of personalized therapy. In order to validate pharmacogenetic and different candidate biomarkers for adenocarcinoma in clinical settings, further studies using multiple approaches are warranted.
MATERIALS AND METHODS
Patients characteristics and inclusion criteria
In this study, we used 23 cell isolates from pleural effusion of 16 patients diagnosed with metastatic adenocarcinoma originating in the lung and pleural effusions from four patients with benign pleural effusions. The malignant samples were received from five men and eleven women with a median age of 67.5 years, ranging from 50 to 89 years. The effusions were received from the diagnostic routine at the Department of Pathology and Cytology, Karolinska University Hospital in Huddinge, Sweden. The samples were collected between 2008 and 2011 and the study was approved by the regional ethics committee in Stockholm. The baseline clinico-pathologic characteristics of the patients are summarized in Table 1.
Malignant cells obtained from pleural effusions were evaluated through a combination of cytomorphology and ICC in order to confirm their phenotype and origin. The immunocytochemical analysis comprised of a staining profile including the epithelial cell adhesion molecule BerEp4, CK7, TTF-1 and Napsin A supporting an alien cell population of lung origin. The proportion of malignant cells was estimated from two cytospin preparations, one stained by BerEp4 immunocytochemistry and one according to MGG. The proportions were evaluated independently by two experienced cytopathologists (KD and AH), discussing discrepant cases to reach consensus.
The included benign pleural effusions contained benign mesothelial cells with admixture of inflammatory cells, without further information of their etiology and without any morphological sign of malignancy. Six months after collecting the benign effusions all four patients were still alive without any diagnosed malignancy. These cell isolates have previously been used as control cells in similar experiments with mesothelioma cells.[10]
Cell culturing
For culturing of primary cells the effusions were centrifuged at 400 g, 5 min and cells were seeded in Iscove’s modified Dulbecco’s medium (Sigma-Aldrich, St. Louis, USA) containing 20% FBS (Fetal Bovine Serum, Invitrogen, Carlsbad, USA), 0.2% Gentamicin (Invitrogen), 1% Penicillin Streptomycin (Invitrogen) and 1% L-glutamine (Invitrogen). To optimize the cell isolation procedure, the appearance of the tumor cells in the effusion was considered. Thus two effusions contained substantial amounts of papillary groups; these groups were separated from disassociated cells by shaking the cell flasks after 24 hours, collecting the floating cells and reseeding them in new flasks. These cell isolates were then separated a second time by reseeding the floating papillary groups (summarized in Table 1).
Cytotoxicity assay
Adherent primary cells were grown to 80-95% confluence, washed with phosphate buffer saline and trypsinized (Invitrogen). They were than counted and seeded. To test the ex vivo drug sensitivity of primary cells, the iVV assay (QantaScope AB, Sweden) was used, where the primary cells were assessed using a 3-day culture on 384 well microtiter plate as previously described.[28][29] Briefly, 32 drugs (Additional file 1) were tested, each at four concentrations (diluted 1:1, 1:5, 1:25 and 1:125) covering a clinically relevant concentration span. Each well was loaded with 30µl OmniSanguine (QantaScope AB, Sweden) primary cell culture medium containing 3.000-5.000 cells.[30] Untreated control cells were grown on the same plate and in the same conditions. After 72 hours of incubation the living and dead cells were differentially stained using VitalDye (QantaScope AB, Sweden). The precise numbers of living and dead cells were measured using Qantascope HexascopeHAEMA automated scanning and analyzing system (Qantascope AB, Stockholm, Sweden).
For each sample the drug effects were automatically calculated as previously described.[10] Briefly, the drug effect is given on a 0-100 scale where no cell killing effect of the drugs gives 0, and killing all the cells even at the lowest concentration gives 100. A considerable variation in the proportion of tumor cells in the different cell isolates was observed. This was compensated by correcting the drug efficiency to the proportion of tumor cells and the supposed effect of drugs on the benign cells present in the preparation, the resulting measure being called “adjusted drug efficiency”.[10] The latter effect was estimated assuming that the benign cells present were affected by the individual drugs in the same magnitude as the corresponding average from the four benign control samples.
Immunocytochemistry
Cytospin preparations of adenocarcinoma cells were performed on SuperFrost Plus glass slide (Thermo Fisher Scientific Inc., Waltham, MA, USA), fixed with 25% ethanol, 25% methanol, 3% polyethylene glycol (PEG) in H2 O and stored at -20°C. PEG was extracted before staining, by decreasing concentrations of ethanol. Immunostaining was performed in a Leica BOND-III automated IHC with relevant isotype controls, diluted in BOND Primary Antibody Diluent (Leica Microsystems GmbH) and detected with the Bond Polymer Refine Detection kit (Leica Microsystems GmbH) or Bond Polymer Refine Red Detection kit (Leica Microsystems GmbH) according to the manufacturer’s protocol. Briefly, for detection of BerEp4, Calretinin, TTF-1, Napsin A and CD45 slides were pretreated 5 min in a citrate buffer pH 6.0 (Bond Epitope Retrieval Solution 1, Leica Microsystems GmbH), while an EDTA buffer pH 9.0 (Bond Epitope Retrieval Solution 2, Leica Microsystems GmbH) was used for 20 min for ERCC1 and RRM1 staining. Endogenous peroxidase activity was abolished with 3% hydrogen-peroxide. Slides were then treated with primary antibodies according to Additional file 2 for 30 min whereafter secondary antibody carrying poly-HRP was added and incubated for 15 min. Bound antibodies were then visualized by Diaminobenzidine treatment for 10 min and followed by 10 min counterstain with hematoxylin. Double staining was performed for Ber-EP4 and Calretinin as well as TTF-1 and Napsin A, to distinguish Ber-EP4 and TTF-1 positive adenocarcinoma cells from mesothelial cells. Ber-EP4 and TTF-1 were detected as described above whereafter Calretinin and Napsin A were detected with a secondary conjugated antibody, incubated with poly-AP and developed with Fast red. All slides were independently evaluated by two experienced cytopathologists (KD and AH) who rated the amount of malignant cells from 0-100% and the staining intensity from 0 to 3 (0 representing no staining and 3 representing strong staining). Discrepant cases were re-evaluated and discussed to reach consensus.
Statistical analysis
Linear regression analyses were performed to examine possible correlations. A Log-rank (Mantel-Cox) test with two-tailed p-values was performed to compare survival data in the Kaplan-Meier plots. Subgroup comparisons were performed with an unpaired t-test with two-tailed p-values. The association between the level of ERCC1 and RRM1 and chemo-sensitivity of the primary cells was calculated using a linear regression analysis as well. For the two-dimensional hierarchical clustering the GENE-E 3.0.210 program (Broad Institute) was used.
ACKNOWLEDGMENTS
The authors would like to thank Mervi Nurminen, Carmen Flores-Staino and Gunilla Fahlström for expert laboratory and technical assistance. This study has been supported by the Swedish Heart and Lung Foundation, AFA Insurance, The Cancer Research Foundations of Radiumhemmet and the Swedish Cancer Society.
CONFLICT OF INTEREST
The authors declare that they have no competing interests.
- 1. Int J Cancer 2010, 127(12):2893-2917.
- 2. Semin Oncol 2014, 41(1):28-39.
- 3. Clin Cancer Res 2009, 15(18):5626-5645.
- 4. Histopathology 2001, 39(4):397-401.
- 7. BMC Cancer 2014, 14:280.
- 8. BMJ Support Palliat Care 2013.
- 11. PLoS One 2013, 8(6):e65903.
- 12. Oncol Rep 2004, 11(3):559-595.
- 13. Curr Probl Cancer 1998, 22(2):85-132.
- 16. Cancer Manag Res 2013, 5:327-336.
- 18. J Clin Oncol 2006, 24(29):4731-4737.
- 19. Cancer Res 2010, 70(9):38513852; author reply 3852.
- 20. Cancer Res 1992, 52(20):5674-5680.
- 22. Ann Oncol 2013, 24(2):309-314.
- 23. Cancer Chemother Pharmacol 2014, 74(4):839-846.
- 26. Cancer Res 2009, 69(17):6831-6838.
Last Modified: 2016-06-05 21:39:01 EDT
PII: 56
