Genes & Cancer
The role of FLI-1-EWS, a fusion gene reciprocal to EWS-FLI-1, in Ewing sarcoma
David J. Elzi1, Meihua Song1, Peter J. Houghton1,2,3, Yidong Chen1,2,4 and Yuzuru Shiio1,2,5
1 Greehey Children’s Cancer Research Institute, The University of Texas Health Science Center, San Antonio, Texas, USA
2 Cancer Therapy and Research Center, The University of Texas Health Science Center, San Antonio, Texas, USA
3 Department of Molecular Medicine, The University of Texas Health Science Center, San Antonio, Texas, USA
4 Department of Epidemiology and Biostatistics, The University of Texas Health Science Center, San Antonio, Texas, USA
5 Department of Biochemistry, The University of Texas Health Science Center, San Antonio, Texas, USA
Correspondence to: Yuzuru Shiio, email: [email protected]
Keywords: EWS-FLI-1, Ewing sarcoma, FLI-1-EWS
Received: September 14, 2015
Accepted: November 05, 2015
Published: November 07, 2015
This is an open-access article distributed under the terms of the Creative Commons Attribution License, which permits unrestricted use, distribution, and reproduction in any medium, provided the original author and source are credited.
ABSTRACT
Ewing sarcoma is a cancer of bone and soft tissue in children that is characterized by a chromosomal translocation involving EWS and an Ets family transcription factor, most commonly FLI-1. The EWS-FLI-1 fusion oncogene is widely believed to play a central role in Ewing sarcoma. The EWS-FLI-1 gene product regulates the expression of a number of genes important for cancer progression, can transform mouse cells such as NIH3T3 and C3H10T1/2, and is necessary for proliferation and tumorigenicity of Ewing sarcoma cells, suggesting that EWS-FLI-1 is the causative oncogene. However, a variety of evidence also suggest that EWS-FLI-1 alone cannot fully explain the Ewing sarcomagenesis.
Here we report that FLI-1-EWS, a fusion gene reciprocal to EWS-FLI-1, is frequently expressed in Ewing sarcoma. We present evidence suggesting that endogenous FLI-1-EWS is required for Ewing sarcoma growth and that FLI-1-EWS cooperates with EWS-FLI-1 in human mesenchymal stem cells, putative cells of origin of Ewing sarcoma, through abrogation of the proliferation arrest induced by EWS-FLI-1.
INTRODUCTION
Ewing sarcoma is an aggressive cancer of bone and soft tissues in children with poor long-term outcome. Ewing sarcoma is characterized by the reciprocal chromosomal translocation generating a fusion oncogene between EWS and an Ets family transcription factor, most commonly FLI-1 [1-5]. EWS-FLI-1 translocation accounts for 85% of Ewing sarcoma cases.
Since the cloning of the EWS-FLI-1 fusion oncogene [6], the predominant view in the Ewing sarcoma field has been that EWS-FLI-1 plays a central role in Ewing sarcomagenesis [1-5]. The EWS-FLI-1 gene product regulates the expression of a number of genes important for cancer progression [7], can transform mouse cells such as NIH3T3 [8] and C3H10T1/2 [9], and is necessary for proliferation and tumorigenicity of Ewing sarcoma cells [1-5], suggesting that EWS-FLI-1 is the causative oncogene.
However, a variety of evidence also suggest that EWS-FLI-1 alone cannot fully explain the Ewing sarcomagenesis: 1) EWS-FLI-1 alone cannot transform any human cell types including mesenchymal stem cells (MSCs) which are the putative cells of origin of Ewing sarcoma [1-4]; 2) Generating a transgenic mouse model of Ewing sarcoma by using EWS-FLI-1 alone has been unsuccessful [1-3]; and 3) Other genetic alterations such as mutations of INK4a and p53, although far less common than EWS-FLI-1 translocation, confer worse clinical outcome [1, 2].
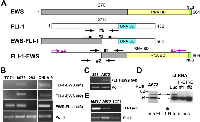
Recent genome sequencing studies confirmed the long-held view that EWS-FLI-1 translocation is the only recurrent genetic alteration commonly found in Ewing sarcoma [10-12]. This chromosomal translocation generates two fusion genes, EWS-FLI-1 and FLI-1-EWS (Figure 1A). Previous research has been centered on EWS-FLI-1, which is considered as the main oncogenic driver of Ewing sarcoma. In contrast, the reciprocal fusion gene, FLI-1-EWS, has not been studied because the attempts to detect FLI-1-EWS mRNA expression in Ewing sarcoma mainly by Northern blotting were not successful [6, 13, 14] and the translocated chromosome encoding FLI-1-EWS can be lost secondarily in a small subset of Ewing sarcoma cells [15].
We have now discovered that FLI-1-EWS is frequently expressed in Ewing sarcoma and have obtained data indicating that endogenous FLI-1-EWS is required for Ewing sarcoma growth and that FLI-1-EWS cooperates with EWS-FLI-1 in human MSCs through abrogation of the growth arrest induced by EWS-FLI-1.
RESULTS & DISCUSSION
FLI-1-EWS expression in Ewing sarcoma
The reciprocal chromosomal translocation between EWS and FLI-1 in Ewing sarcoma generates two fusion genes, EWS-FLI-1 and FLI-1-EWS (Figure 1A). Although previous studies failed to detect the expression of FLI-1-EWS in Ewing sarcoma by Northern blotting [6, 13, 14], we became interested in the possibility that FLI-1-EWS is expressed in some Ewing sarcoma cells or was expressed when the EWS-FLI-1 chromosomal translocation occurred in the Ewing sarcoma cell of origin. Using two different pairs of PCR primers (#1 and #2, see Figure 1A), we were able to detect the FLI-1-EWS fusion transcript in A673 and CHLA-9, but not in TC71 Ewing sarcoma cells (Figure 1B and Supplementary Table S1; Note the primers used for PCR amplification span a 9-kb intron in FLI-1 and the genomic locus cannot be amplified; RNA polymerase II (Pol II) serves as a loading control; Human kidney 293 cells serve as negative control). The EWS-FLI-1 fusion transcript (type 1) was detectable in A673, CHLA-9, and TC71, but not in 293 (Figure 1B and Supplementary Table S1). Furthermore, by optimizing the RT-PCR conditions for longer transcripts, we were able to amplify nearly full-length FLI-1-EWS ORF (including the initiation codon, using primer pair #4, Figure 1C) from A673 cellular RNA. We went on to clone the nearly full-length FLI-1-EWS ORF amplified from A673 cells and verified its entire DNA sequence as FLI-1-EWS, unequivocally proving the existence of FLI-1-EWS transcript in A673 cells. Importantly, we were able to detect endogenous FLI-1-EWS protein (~75 kDa) in A673 cells by anti-FLI-1 N-terminus antibody immunoblotting, which was silenced by two shRNAs that target the junction of FLI-1 and EWS in FLI-1-EWS (Figure 1D; Note these shRNAs also silenced FLI-1-EWS mRNA, see Figure 3A). We also analyzed the expression of FLI-1 using primers specific to un-translocated FLI-1 (#5 in Figure 1A) and detected FLI-1 mRNA expression in A673, but not in TC71 cells (Figure 1E). Interestingly, human primary mesenchymal stem cells (MSCs), the putative cells of origin of Ewing sarcoma [1-4], expressed higher levels of FLI-1 than A673 cells (Figure 1E and Supplementary Table S2). This indicates that the FLI-1 gene promoter is active in MSCs and suggests that FLI-1-EWS would be expressed if EWS-FLI-1 translocation occurs in MSCs.
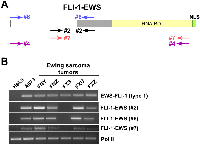
As an initial screen for the prevalence of FLI-1-EWS expression in Ewing sarcoma tumors, we obtained Ewing sarcoma tumor RNA samples from the Cooperative Human Tissue Network and analyzed the expression of FLI-1-EWS. Of the five tumors expressing EWS-FLI-1 fusion transcript (type 1 fusion), four tumors expressed FLI-1-EWS (Figure 2 and Supplementary Table S3). Using the primer pair #4 (Figure 1A and 2A), we amplified nearly full-length FLI-1-EWS ORF from case FNY RNA sample and verified its entire DNA sequence as FLI-1-EWS, proving the existence of FLI-1-EWS transcript in Ewing sarcoma tumor. These results suggest that FLI-1-EWS expression is prevalent in Ewing sarcoma cell lines and tumors.
FLI-1-EWS makes a positive contribution to Ewing sarcoma growth
To gain an insight into the function of FLI-1-EWS in Ewing sarcoma cells, we employed two shRNAs that target the junction of FLI-1 and EWS in FLI-1-EWS and expressed these shRNAs in A673 and CHLA-9 Ewing sarcoma cells using lentiviral vectors, which resulted in the silencing of FLI-1-EWS (Figure 3A, 3C, and 1D; luciferase shRNA-expressing virus serves as control; Note FLI-1-EWS shRNAs did not affect the expression of EWS-FLI-1, FLI-1, or EWS) and significant inhibition of proliferation as determined by Ki-67 staining (Figure 3B and 3D; asterisks denote p< 0.05 compared to luciferase shRNA control). This demonstrates that endogenous FLI-1-EWS makes a positive contribution to Ewing sarcoma cell proliferation.
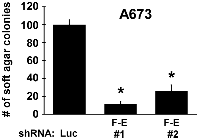
One of the hallmarks of cancer is the ability to proliferate independent of anchorage. Importantly, silencing of FLI-1-EWS in A673 cells resulted in dramatic inhibition of soft agar colony formation (Figure 4), indicating that FLI-1-EWS plays an essential role in anchorage-independent growth of Ewing sarcoma cells.
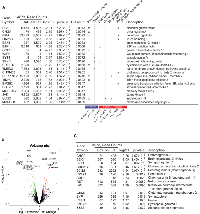
To further dissect the biological role of FLI-1-EWS, global mRNA expression changes induced by FLI-1-EWS silencing were analyzed by RNA-sequencing (Figure 5 and Supplementary Table S4). Interestingly we found upregulation of a number of neural genes in FLI-1-EWS-silenced A673 cells (Figure 5C). Ewing sarcoma has a tendency for neural differentiation in response to a variety of stimuli including cAMP, TPA, retinoic acid, and Wnt signaling [16-18]. Induction of neural genes upon FLI-1-EWS silencing might suggest that FLI-1-EWS prevents neural differentiation of Ewing sarcoma cells and maintains their continuous proliferation.
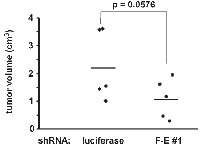
To test the role of FLI-1-EWS in the tumorigenicity of Ewing sarcoma, we employed xenograft tumorigenicity assays in SCID mice. A673 cells were infected with lentiviruses expressing shRNA against FLI-1-EWS or luciferase. After puromycin selection, cells were subcutaneously injected into the flanks of SCID mice. Tumor volume was determined four weeks after injection. As shown in Figure 6, FLI-1-EWS silencing reduced xenograft tumor growth (p = 0.0576).
These results indicate that endogenous FLI-1-EWS makes a positive contribution to Ewing sarcoma growth.
FLI-1-EWS and EWS-FLI-1 cooperate in mesenchymal stem cells
Although EWS-FLI-1 is considered an oncogene, its expression often displays toxicity: Expression of EWS-FLI-1 is known to potently inhibit the proliferation of primary human and mouse fibroblasts; transgenic expression of EWS-FLI-1 in mice results in lethality, which is considered one of the major obstacles to the development of a mouse model of Ewing sarcoma. To test whether FLI-1-EWS cooperates with EWS-FLI-1 by alleviating the toxicity of EWS-FLI-1, we co-expressed FLI-1-EWS and EWS-FLI-1 in human mesenchymal stem cells (MSCs), putative cells of origin of Ewing sarcoma. Human MSCs (derived from cord blood, purchased from Vitro BioPharma) were infected with lentiviruses expressing FLI-1-EWS, EWS-FLI-1, or both (empty vector as control). We reproducibly observed the proliferation arrest of human MSCs by EWS-FLI-1, which was abolished by the co-expression of FLI-1-EWS (Figure 7, proliferation assessed by BrdU incorporation). The expression of FLI-1-EWS and EWS-FLI1 was verified by immunoblotting (Figure 7) and quantitative RT-PCR (Supplementary Table S5). The abrogation of EWS-FLI-1-induced proliferation arrest by FLI-1-EWS in human MSCs raises an important possibility that these two fusion genes generated by reciprocal chromosomal translocation cooperate in the cells of origin of Ewing sarcoma and together drive tumor initiation.
Chromosomal translocation is frequently associated with sarcomas and hematological malignancies and often generates two fusion genes. Typically, one of the two fusion genes is invariably expressed in tumors, displays oncogenic property, and is hence intensively studied as a main oncogenic driver whereas the reciprocal fusion gene receives much less attention for reasons including variable expression in established tumors, lack of oncogenic property, and lack of major functional domains encoded by the parental genes. Accumulating evidence, however, suggests that reciprocal fusion genes can contribute to tumorigenesis and disease phenotype in conjunction with their reciprocal oncogenic fusion partners [19-24]. A common theme emerged from these studies is that the biological roles of reciprocal fusion genes need to be more carefully examined, given the limitation of available experimental tools to study tumor initiation process in humans.
Here we provide several lines of evidence that FLI-1-EWS, a fusion gene reciprocal to EWS-FLI-1, is frequently expressed in Ewing sarcoma and contributes to tumor cell growth. FLI-1-EWS abrogated the toxicity displayed by EWS-FLI-1 in human MSCs, which is in principle consistent with the notion that the two fusion genes cooperate at the early stage of Ewing sarcomagenesis. Although the EWS-FLI-1 transcript, which is driven by the gene promoter for highly expressed EWS [25], was one to two orders of magnitude more abundant than the FLI-1-EWS transcript in Ewing sarcoma cell lines and tumors (Supplementary Table S1 and S3), silencing FLI-1-EWS nonetheless impaired anchorage-dependent and anchorage-independent growth as well as tumorigenicity of Ewing sarcoma, indicating that FLI-1-EWS plays an important role in this tumor. Furthermore, we found that the FLI-1 transcript levels are several hundred-fold higher in human MSCs than in A673 Ewing sarcoma cells (Supplementary Table S2), suggesting that a considerable amount of FLI-1-EWS transcript could be expressed when EWS-FLI-1 translocation occurred in MSCs, putative Ewing sarcoma cells of origin. It is possible that high levels of FLI-1-EWS contribute to the initiation of Ewing sarcoma while the FLI-1-EWS expression declines during tumor progression, which might explain the lack of FLI-1-EWS expression in some Ewing sarcoma cells such as TC71 (Figure 1B).
Whereas FLI-1-EWS knockdown inhibited the anchorage-dependent and anchorage-independent growth of Ewing sarcoma and FLI-1-EWS cooperated with EWS-FLI-1 in mesenchymal stem cells, we found that FLI-1-EWS itself is not sufficient to transform mouse NIH3T3 cells and that FLI-1-EWS alone is not sufficient to make cells proliferate independent of anchorage. These findings suggest the possibility that FLI-1-EWS acts in cooperation with EWS-FLI-1 to drive Ewing sarcomagenesis.
The molecular mechanism of FLI-1-EWS action is not yet clear. One possibility is that FLI-1-EWS sequesters certain RNAs through its RNA-binding domain (Figure 1A). EWS and its paralogues, FUS and TAF15, harbor prion-like low-complexity domains at their N-termini which could form higher-order fibrous assemblies [26-29]. Because FLI-1-EWS lacks the N-terminal low-complexity domain, the RNAs bound by FLI-1-EWS may not be recruited to the postulated fibrous assemblies containing EWS. Alternatively, FLI-1-EWS might have a gain of function as is the case for EWS-FLI-1. The C-terminal portion of EWS, FUS, and TAF15 was recently shown to function as a sensor of poly(ADP-ribose) [30]. EWS, FUS, and TAF15 mediated poly(ADP-ribose)-seeded liquid de-mixing and assembly of intrinsically disordered proteins at the sites of DNA damage [30]. FLI-1-EWS might similarly sense poly(ADP-ribose) using its C-terminal domain and recruit the N-terminal transcriptional activation domain of FLI-1 to the sites of poly(ADP-ribose) accumulation, altering gene expression. To address how FLI-1-EWS functions, it will be important to characterize the protein interactors for FLI-1-EWS. It will also be important to test whether the cooperation between FLI-1-EWS and EWS-FLI-1 can be used to develop an animal model of Ewing sarcoma. Future work should clarify the precise role of FLI-1-EWS in Ewing sarcomagenesis.
MATERIALS AND METHODS
Cell culture
293 and 293T cells were cultured in Dulbecco’s modified Eagle’s medium (DMEM) supplemented with 10% calf serum. A673 cells were cultured in DMEM supplemented with 10% fetal calf serum. CHLA-9 cells and TC71 cells were cultured in RPMI1640 medium supplemented with 10% fetal calf serum. Cord blood-derived human mesenchymal stem cells were purchased from Vitro Biopharma (Golden, CO) and cultured in low serum MSC-GRO following the manufacturer’s procedure. Calcium phosphate co-precipitation was used for transfection of 293T cells. Lentiviruses were prepared by transfection in 293T cells following System Biosciences’ protocol and the cells infected with lentiviruses were selected with 2 μg/ml puromycin for 48 hours as described [31, 32]. For co-infection of human mesenchymal stem cells, the infected cells were selected with 2 μg/ml puromycin and 150 μg/ml hygromycin for 48 hours. FLI-1-EWS cDNA (see Figure 1A) was cloned into pCDH1-puro lentiviral vector (System Biosciences) and EWS-FLI-1 cDNA was cloned into a modified pCDH1 vector with hygromycin resistance marker. The target sequences for shRNAs are as follows: FLI-1-EWS shRNA-1, GAGTGTCAAAGAAGGTTCATT; FLI-1-EWS shRNA-2, CAAAGAAGGTTCATTCCGACA; and luciferase shRNA, GCACTCTGATTGACAAATACGATTT. The shRNAs were expressed using pSIH-H1-puro lentiviral vector (System Biosciences).
RT-PCR
Total cellular RNA was isolated using TRIzol reagent (Invitrogen) and RT-PCR was performed as described previously [31, 32], using GoTaq DNA polymerase or GoTaq Hot Start polymerase (Promega). The PCR cycle numbers were FLI-1-EWS (40), EWS-FLI-1 (25), FLI-1 (40), EWS (25), and RNA polymerase II (25). The following primers were used (see Figure 1A for the location of primers): FLI-1-EWS #1 5’ primer, AATACAACCTCCCACACCGA, 3’ primer, ACTCCTGCCCATAAACACCC; FLI-1-EWS #2 5’ primer, GTGCTGTTGTCACACCTCAG, 3’ primer, GTTCTCTCCTGGTCCGGAAA; EWS-FLI-1 #3 5’ primer, GCACCTCCATCCTACCCTCCT, 3’ primer, TGGCAGTGGGTGGGTCTTCAT; Fli-1-EWS #4, 5’ primer, ATGGACGGGACTATTAAGGA, 3’ primer, CTCGTCTTCCTCCACCAAAG; Fli-1 #5, 5’ primer, AATACAACCTCCACACCGA, 3’ primer, CTTACTGATCGTTTGTGCCCC; Fli-1-EWS #6, 5’ primer, ATGGACGGGACTATTAAGGA, 3’ primer, GTTCTCTCCTGGTCCGGAAA; Fli-1-EWS #7 5’ primer, GTGCTGTTGTCACACCTCAG, 3’ primer, CTCGTCTTCCTCCACCAAAG; EWS 5’ primer, CAGCCTCCCACTAGTTACCC, 3’ primer, GTTCTCTCCTGGTCCGGAAA; and RNA polymerase II (Pol II) 5′ primer, GGATGACCTGACTCACAAACTG, 3′ primer, CGCCCAGACTTCTGCATGG. The quantitative real-time RT-PCR was performed using GoTaq® qPCR Master Mix (Promega) and 7500 Real-Time PCR System (Applied Biosystems). FLI1-EWS #2 primers were used.
Immunoblotting and immunofluorescence
Immunoblotting and immunofluorescence were performed as described [31, 32]. The following antibodies were used: mouse monoclonal anti-BrdU (BD Pharmingen); sheep polyclonal anti-FLI-1 (AF6474, R&D Systems); rabbit polyclonal anti-FLI-1 (ab15289, Abcam); mouse monoclonal anti-Ki-67 (BD Pharmingen); and mouse monoclonal anti-tubulin (DM1A, Sigma-Aldrich).
RNA sequencing
A673 cells were infected with lentiviruses expressing FLI-1-EWS shRNA-1 or luciferase shRNA and were selected with 2 µg/ml puromycin. Four days after infection total RNA was isolated using TRIzol reagent (Invitrogen). RNA quality was assessed by Bioanalyzer and poly A(+) RNA was isolated by oligo-dT purification and fragmented using divalent cations under elevated temperature. cDNA fragment libraries were synthesized following the TruSeq mRNA-seq Library Preparation protocol (Illumina, San Diego, CA). We obtained 24.3 and 20.2 million sequence reads for control and FLI-1-EWS knockdown samples, respectively, using Illumina HiSeq system at the Greehey Children’s Cancer Research Institute Genome Sequencing Facility, employing a 50bp single-read sequencing protocol.
Sequence reads were first aligned with TopHat [33] to human genome (NCBI GRCh37/UCSC hg19), allowing no more than 2 mismatches in the alignment. After alignment, reads aligned to known transcripts were counted using HTSeq [34]. Expression abundance of each gene was evaluated by a unit of read count and RPKM (read per kilobase of transcript per million reads mapped). Differential gene expression was calculated using DESeq [35] to obtain fold-change, p-value, and p-value adjusted by Benjamini-Hochberg correction for multiple tests [36]. We selected differentially expressed genes based on the following criteria: 1) fold-change > 2 (and adjusted p-value < 0.05) and 2) RPKM > 1. Functional assessment of these differentially expressed genes was performed by using Database for Annotation, Visualization and Integrated Discovery (DAVID, http://david.abcc.ncifcrf.gov/) [37] and Ingenuity pathway analysis (IPA, Ingenuity Systems, http://www.ingenuity.com).
Soft agar colony formation assays
A673 cells were infected with lentiviruses expressing shRNAs against FLI-1-EWS or luciferase and were selected with 2 µg/ml puromycin. Four days after infection, 1x10³ cells were plated in soft agar. The soft agar cultures were comprised of two layers: a base layer (2 ml/well in a 6-well plate; DMEM/10% fetal calf serum and 1.2% agarose) and a cell layer (2 ml/well in a 6-well plate; DMEM/10% fetal calf serum and 0.6% agarose). Colonies were grown for one week and counted.
Xenograft tumorigenicity assays
A673 cells were infected with lentiviruses expressing FLI-1-EWS shRNA-1 or luciferase shRNA and were selected with 2 µg/ml puromycin for 2 days. Each cell type was subcutaneously injected into the flanks of SCID mice (2x10⁶ cells/injection, n=5). Tumor growth was monitored weekly using a caliper.
Tumor RNA samples
De-identified Ewing sarcoma tumor RNA samples were obtained from the Cooperative Human Tissue Network.
ACKNOWLEDGMENTS
We thank the Genome Sequencing Facility/the CTRC Next Generation Sequencing Shared Resource at Greehey Children’s Cancer Research Center, which provided RNA sequencing and bioinformatics services. We thank the Cooperative Human Tissue Network for Ewing sarcoma tumor RNA samples and Dr. Fuchun Zhou for critical reading of the manuscript. This work was supported by the Owens Medical Research Foundation (#154005 to Y.S.), by the National Cancer Institute, the National Institutes of Health, (CA165995 to P.J.H.), by the Cancer Prevention and Research Institute of Texas (RP120685-C2 to Y.C.), by the National Center for Advancing Translational Sciences, National Institutes of Health, through the Clinical and Translational Science Award (CTSA) UL1 TR001120, and by the CTRC P30 Cancer Center Support Grant from the National Cancer Institute (CA054174).
CONFLICTS OF INTERESTS
The authors declared no potential conflicts of interest with respect to the research, authorship, and/or publication of this article.
- 1. Recent advances in the molecular pathogenesis of Ewing’s sarcoma. Oncogene. 2010; 29(32):4504-4516. [PubMed] https://doi.org/10.1038/onc.2010.205.
- 2. The molecular pathogenesis of Ewing’s sarcoma. Cancer Biol Ther. 2010; 9(9):655-667. [PubMed]
- 3. Ewing Sarcoma, an enigmatic malignancy of likely progenitor cell origin, driven by transcription factor oncogenic fusions. Int J Clin Exp Pathol. 2010; 3(4):338347. [PubMed]
- 4. Molecular pathogenesis of Ewing sarcoma: new therapeutic and transcriptional targets. Annu Rev Pathol. 2012; 7:145-159. [PubMed] https://doi.org/10.1146/annurev-pathol-011110-130237.
- 5. Prospects and challenges for the development of new therapies for Ewing sarcoma. Pharmacol Ther. 2012; 137(2):216-224. [PubMed]
- 6. Gene fusion with an ETS DNA-binding domain caused by chromosome translocation in human tumours. Nature. 1992; 359(6391):162-165.
- 7. A transcriptional profiling meta-analysis reveals a core EWS-FLI gene expression signature. Cell Cycle. 2008; 7(2):250-256. [PubMed]
- 8. Ewing sarcoma 11;22 translocation produces a chimeric transcription factor that requires the DNA-binding domain encoded by FLI1 for transformation. Proc Natl Acad Sci U S A. 1993; 90(12):5752-5756. [PubMed] https://doi.org/10.1073/pnas.90.12.5752.
- 9. EWS/FLI-1 oncoprotein subtypes impose different requirements for transformation and metastatic activity in a murine model. J Mol Med (Berl). 2007; 85(9):1015-1029. [PubMed]
- 10. The genomic landscape of the Ewing Sarcoma family of tumors reveals recurrent STAG2 mutation. PLoS genetics. 2014; 10(7):e1004475. [PubMed] https://doi.org/10.1371/journal.pgen.1004475.
- 11. The Genomic Landscape of Pediatric Ewing Sarcoma. Cancer Discov. 2014; Sep 3. pii: CD-13-1037. [Epub ahead of print].
- 12. Genomic landscape of Ewing sarcoma defines an aggressive subtype with co-association of STAG2 and TP53 mutations. Cancer Discov. 2014; Sep 15. pii: CD-14-0622. [Epub ahead of print]. [PubMed] https://doi.org/10.1158/2159-8290.CD-14-0622.
- 13. Expression profiling of EWS/FLI identifies NKX2.2 as a critical target gene in Ewing’s sarcoma. Cancer Cell. 2006; 9(5):405-416. [PubMed]
- 14. Promiscuous partnerships in Ewing’s sarcoma. Cancer genetics. 2011; 204(7):351-365. [PubMed] https://doi.org/10.1016/j.cancergen.2011.07.008.
- 15. Chromosome study of Ewing’s sarcoma (ES) cell lines. Consistency of a reciprocal translocation t(11;22)(q24;q12). Cancer Genet Cytogenet. 1984; 12(1):1-19.
- 16. Experimental evidence for a neural origin of Ewing’s sarcoma of bone. Am J Pathol. 1987; 127(3):507-518. [PubMed]
- 17. Dynamic model of differentiation in Ewing’s sarcoma cells. Comparative analysis of morphologic, immunocytochemical, and oncogene expression parameters. Lab Invest. 1992; 66(2):143-151.
- 18. Wnt-3a and Dickkopf-1 stimulate neurite outgrowth in Ewing tumor cells via a Frizzled3- and c-Jun N-terminal kinase-dependent mechanism. Mol Cell Biol. 2008; 28(7):2368-2379. [PubMed] https://doi.org/10.1128/MCB.01780-07.
- 19. A bcr-3 isoform of RARalphaPML potentiates the development of PML-RARalphadriven acute promyelocytic leukemia. Proc Natl Acad Sci U S A. 1999; 96(26):15103-15108. [PubMed] https://doi.org/10.1073/pnas.96.26.15103.
- 20. Two critical hits for promyelocytic leukemia. Mol Cell. 2000; 6(5):1131-1141. [PubMed]
- 21. Reciprocal t(9;22) ABL/BCR fusion proteins: leukemogenic potential and effects on B cell commitment. PLoS One. 2009; 4(10):e7661. [PubMed] https://doi.org/10.1371/journal.pone.0007661.
- 22. The functional interplay between the t(9;22)-associated fusion proteins BCR/ABL and ABL/BCR in Philadelphia chromosome-positive acute lymphatic leukemia. PLoS genetics. 2015; 11(4):e1005144. [PubMed] https://doi.org/10.1371/journal.pgen.1005144.
- 23. The AF4.MLL fusion protein is capable of inducing ALL in mice without requirement of MLL.AF4. Blood. 2010; 115(17):35703579. [PubMed]
- 24. Structural and functional studies of FKHR-PAX3, a reciprocal fusion gene of the t(2;13) chromosomal translocation in alveolar rhabdomyosarcoma. PLoS One. 2013; 8(6):e68065. [PubMed] https://doi.org/10.1371/journal.pone.0068065.
- 25. Biochemical Properties and Biological Functions of FET Proteins. Annu Rev Biochem. 2015; 84:355-379. [PubMed]
- 26. Cellfree formation of RNA granules: low complexity sequence domains form dynamic fibers within hydrogels. Cell. 2012; 149(4):753-767.
- 27. Cell-free formation of RNA granules: bound RNAs identify features and components of cellular assemblies. Cell. 2012; 149(4):768-779. [PubMed]
- 28. Phosphorylation-regulated binding of RNA polymerase II to fibrous polymers of low-complexity domains. Cell. 2013; 155(5):1049-1060. [PubMed] https://doi.org/10.1016/j.cell.2013.10.033.
- 29. RNA seeds higher-order assembly of FUS protein. Cell reports. 2013; 5(4):918-925. [PubMed] https://doi.org/10.1016/j.celrep.2013.11.017.
- 30. Liquid demixing of intrinsically disordered proteins is seeded by poly(ADP-ribose). Nature communications. 2015; 6:8088. [PubMed] https://doi.org/10.1038/ncomms9088.
- 31. Plasminogen activator inhibitor 1--insulin-like growth factor binding protein 3 cascade regulates stressinduced senescence. Proc Natl Acad Sci U S A. 2012; 109(30):12052-12057. [PubMed] https://doi.org/10.1073/pnas.1120437109.
- 32. Wnt Antagonist SFRP1 Functions as a Secreted Mediator of Senescence. Mol Cell Biol. 2012; 32(21):4388-4399. [PubMed] https://doi.org/10.1128/MCB.06023-11.
- 33. TopHat: discovering splice junctions with RNA-Seq. Bioinformatics. 2009; 25(9):1105-1111. [PubMed] https://doi.org/10.1093/bioinformatics/btp120.
- 34. HTSeq--a Python framework to work with high-throughput sequencing data. Bioinformatics. 2015; 31(2):166-169. [PubMed] https://doi.org/10.1093/bioinformatics/btu638.
- 35. Differential expression analysis for sequence count data. Genome Biol. 2010; 11(10):R106. [PubMed] https://doi.org/10.1186/gb-2010-11-10-r106.
- 36. Controlling the false discovery rate: A practical and powerful approach to multiple testing. Journal of the Royal Statistical Society. 1995; 57:289-300.
- 37. Systematic and integrative analysis of large gene lists using DAVID bioinformatics resources. Nat Protoc. 2009; 4(1):44-57. [PubMed]
Last Modified: 2016-06-04 02:44:09 EDT
